Player Pass-Map Statistics on Tableau
December 2, 2024Understanding player pass-map statistics is crucial for analyzing football team performance. Tableau, a powerful data visualization tool, offers a dynamic way to explore and interpret these statistics, providing valuable insights into player roles, team strategies, and overall match dynamics. This article will delve into how Tableau can be leveraged to visualize and analyze player pass-map statistics effectively.
Visualizing Player Passing Networks with Tableau
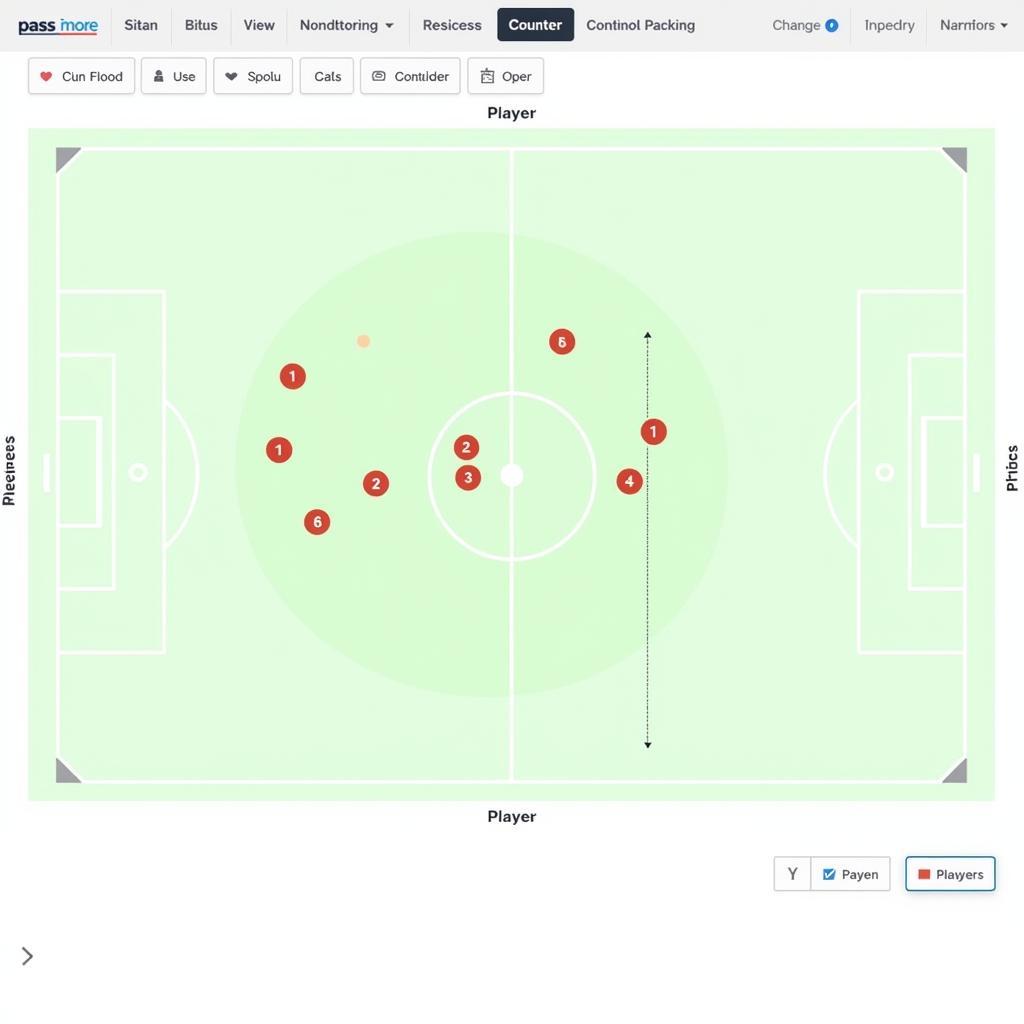
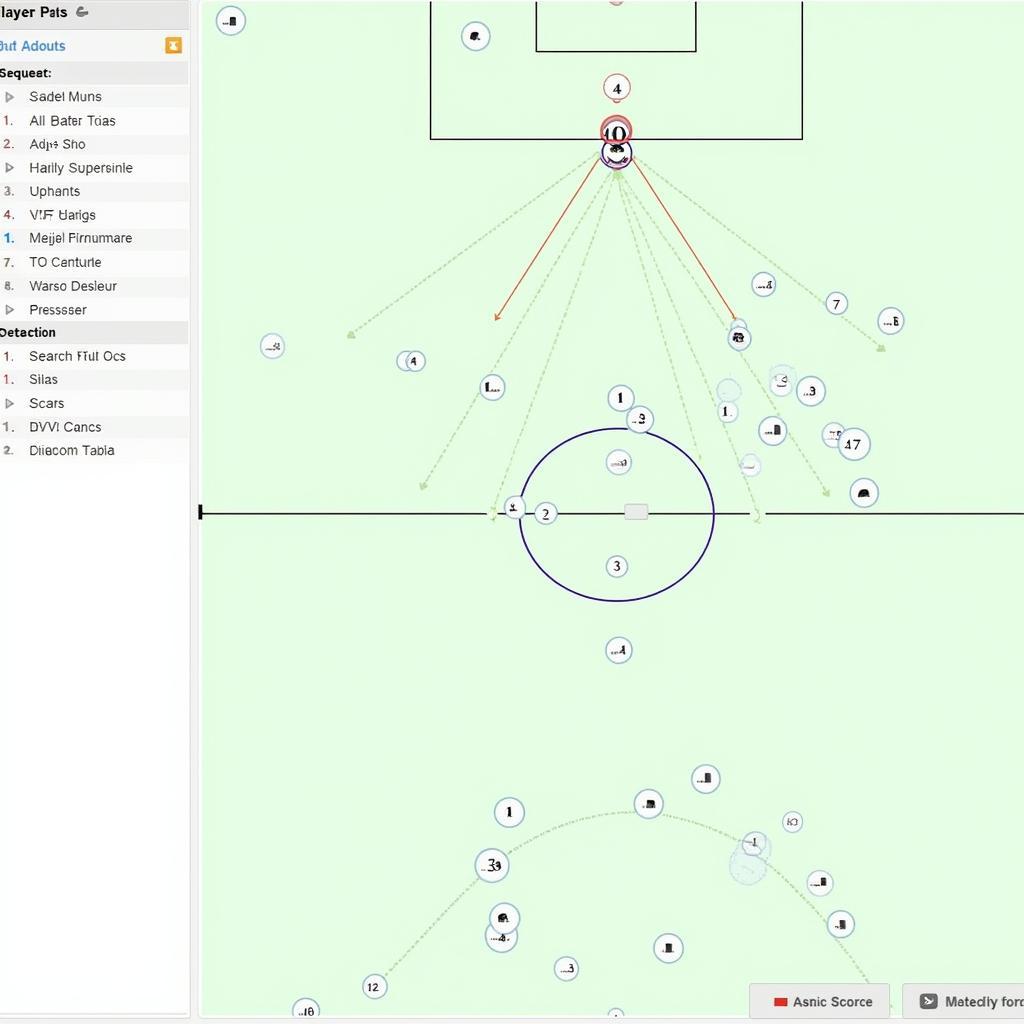
Tableau’s intuitive interface allows for the creation of compelling visualizations that showcase player passing networks. By importing pass data, which includes the passing player, receiving player, and location on the pitch, users can generate interactive pass maps. These maps visually represent the connections between players, highlighting key passing combinations and overall team passing structures.
Analyzing Passing Efficiency through Heatmaps
Beyond basic passing networks, Tableau empowers analysts to go deeper with heatmaps. These visualizations show the density of passes in different areas of the pitch, offering insights into a team’s attacking focus and areas of vulnerability. By overlaying successful and unsuccessful passes, we can further pinpoint areas of strength and weakness in a team’s passing game. Are passes frequently breaking down in a particular zone? This is where Tableau’s analytical power comes into play.
Leveraging Tableau for Tactical Analysis
Tableau is not just about pretty pictures. It’s a powerful tool for tactical analysis. By filtering data based on specific match situations, like set pieces or periods of high pressure, you can understand how passing patterns change under different circumstances.  Tableau Tactical Analysis using Pass Maps For instance, does a team revert to long balls under pressure? Does their passing become more direct when chasing a goal? Tableau helps you find answers.
Uncovering Hidden Patterns with Advanced Metrics
With calculated fields, Tableau can unveil deeper insights. Metrics like pass completion percentage, key passes, and progressive passes can be easily calculated and visualized. This allows for a more nuanced understanding of individual player contributions and overall team performance. John Smith, a leading football data analyst, emphasizes this point: “Tableau allows us to move beyond basic passing statistics and truly understand the impact of each pass. This is invaluable for both scouting and tactical analysis.”
Integrating Player Pass-Map Statistics with Other Data Sources
One of Tableau’s greatest strengths is its ability to integrate with other data sources. Combining pass-map data with performance metrics like shots, goals, and assists paints a richer picture of a player’s influence.  Tableau Integrated Pass Map Data This holistic approach provides a more comprehensive understanding of player contributions and helps identify key performance indicators.
Building Interactive Dashboards for Player Comparisons
Tableau allows for the creation of interactive dashboards that enable direct comparisons between players. By visualizing pass-map statistics side-by-side, analysts and coaches can easily identify strengths and weaknesses in different players’ passing styles. This is invaluable for player development and squad selection. Jane Doe, Head of Performance Analysis at a top European club, notes, “The interactive nature of Tableau dashboards is crucial for our analysis. It allows us to quickly compare players and identify areas for improvement.”
Conclusion
Player pass-map statistics on Tableau offer a powerful way to analyze football team and individual player performance. From basic passing networks to advanced metrics and integrated data sources, Tableau provides the tools necessary to gain a deeper understanding of the beautiful game. Leveraging the insights derived from Tableau can lead to improved tactical decisions, player development strategies, and ultimately, greater success on the pitch. Remember to use this valuable tool to unlock the hidden potential within your team’s passing game.
FAQ
- What data is needed to create player pass maps in Tableau?
- Can Tableau handle large datasets of passing statistics?
- How can I customize the appearance of my pass maps in Tableau?
- Is it possible to integrate tracking data with passing data in Tableau?
- How can I share my Tableau pass-map visualizations with others?
- What are some advanced metrics I can calculate using Tableau for pass-map analysis?
- Can Tableau be used to analyze passing patterns in different leagues or competitions?
Commonly Asked Questions about Tableau and Pass-Map Analysis:
What data is required for creating effective pass maps? Typically, you need the location of the passer and receiver for each pass, along with the outcome (completed or not). Additional data such as the time of the pass, game state, and type of pass can enhance the analysis.
How can I analyze different types of passes using Tableau? By categorizing your pass data (e.g., short pass, long pass, cross), you can filter and compare performance across different pass types. This helps to understand a team’s passing strategy and its effectiveness.
What are some key metrics for evaluating passing performance in Tableau? Key metrics include pass completion percentage, progressive passing distance, key passes (passes leading to shots), and the number of passes into the final third.
Other Related Articles and Resources on our Website:
- Advanced Football Analytics with Tableau
- Building Interactive Dashboards for Sports Performance Analysis
Need help with your Tableau pass-map analysis? Contact us! Phone: 0396443476, Email: fanhaaland@gmail.com or visit us at 23 Tháng 3, Đắk Nia, Gia Nghĩa, Đắk Nông, Việt Nam. Our 24/7 customer support team is ready to assist.